Global Map Progress
Overview
Section titled “Overview”Each week, HONEY rewards are minted for contributors to the Hivemapper Network as map progress is made from a blank slate to a complete and up-to-date map of the world. The precise amount of global rewards depends on the precise amount of progress.
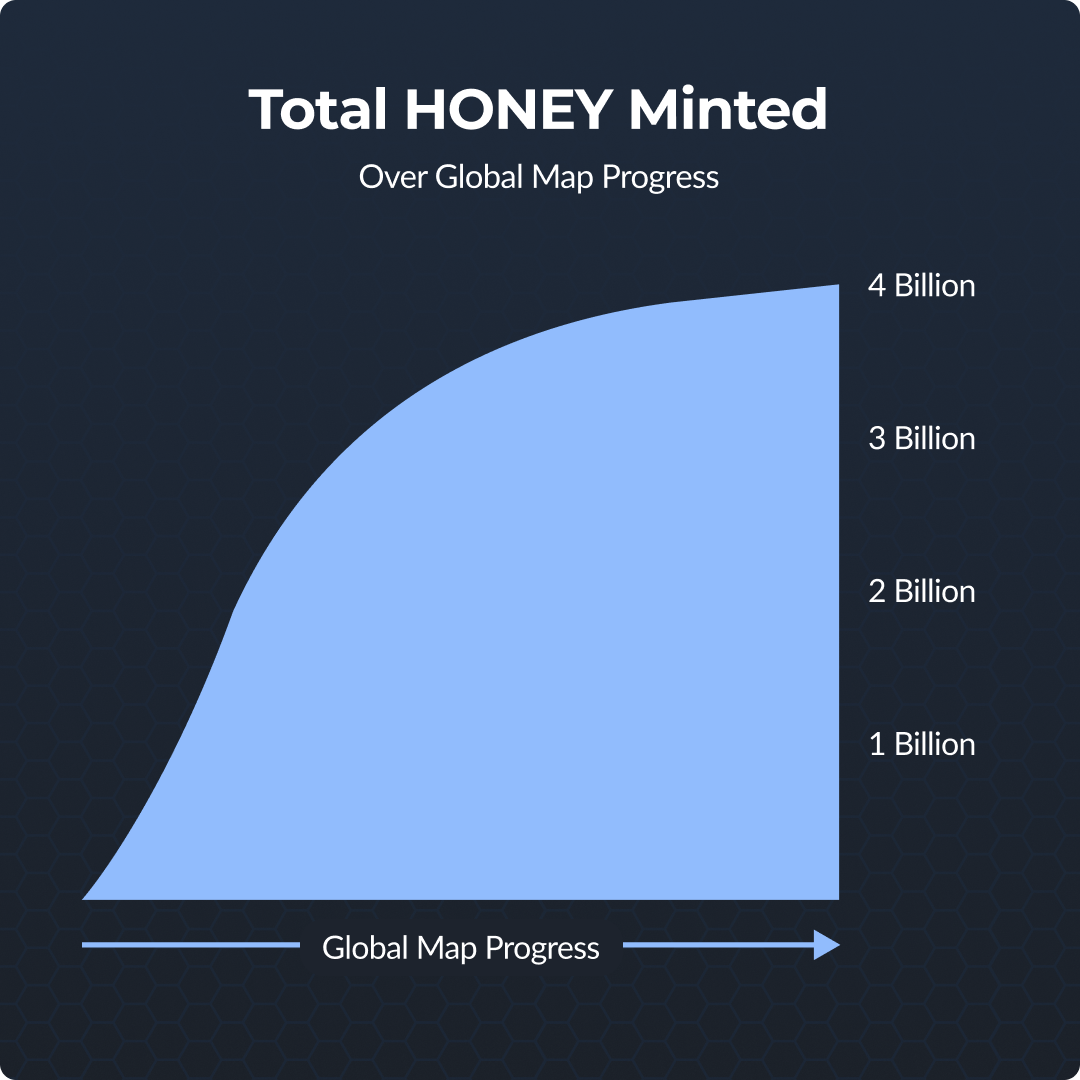
All 4 billion HONEY tokens will be minted as Global Map Progress is made.
Global Map Progress is based on the map progress of each region in the Hivemapper Network. To achieve maximum progress, regions must be dependably well covered and active. These factors put the Hivemapper Network on a path toward building a continuously complete, fresh, and high-quality map.
This dynamic approach is designed to ensure that rewards are never overly concentrated in a particular region, nor in any regions that are not adequately producing map progress.
HONEY rewards are distributed to the contributors of each region based on their respective contributions toward a region’s map progress.
Regions
Section titled “Regions”Regions are defined geographical areas established by the Hivemapper Network. Regional boundaries are the responsibility of the Hivemapper Foundation and subject to change.
Not all regional boundaries have been drawn yet. Major metropolitan areas were drawn first, but eventually all areas will become part of a defined region. By default, regions that haven’t been defined yet fall into a catch-all region.
By policy, a new region is eligible to be created after four consecutive weekly reward cycles with map coverage in an area of the world that is not included in a region. If you think your region is eligible for a region and one hasn’t been created yet, you can fill out this form to call it to the attention of the team.
Region boundaries can be viewed on Explorer by clicking the lower right-hand hamburger menu and activating the Regions layer. Region boundaries are not yet viewable in the Hivemapper app.
Regional Weighting
Section titled “Regional Weighting”Maps are most critical in areas where high amounts of growth and change are occurring and there is current or expected commercial demand for map data. Accordingly, the Hivemapper Network uses a regional weighting system to focus mapping in areas where there is a high utility of the data collected. Each region is assigned a weighting that impacts the calculation of Global Map Progress Units as well as HONEY rewards earned for that region in a given period.
The weighting primarily accounts for the number of kilometers of roads in the region, with a small road density factor. Regional weightings are subject to recalibration as new regions are introduced or existing regions are redefined.
In the “Regions” section of the Explorer, the weighting is displayed as a percent of total. This is the percentage used for the weighted calculation of Global Map Progress and the distribution of HONEY rewards (see below: Example Global MPU Calculation and Example Regional HONEY Calculation).
For clarity, map consumption rewards and Bursts are not impacted by regional weightings.
Region Progress
Section titled “Region Progress”There are three primary factors that determine a region’s map progress in a given time period: coverage, activity, and resilience. The definition of these factors may evolve over time. They were last updated in April 2024 with the implementation of Map Improvement Proposal 14.
- Coverage is computed by a rolling 28-day average of weekly Coverage, the amount of unique surface coverage achieved relative to the estimated total road surface in the region. To receive 100% rewards, at least 20% coverage progress must be achieved. Rewards scale between 0% and 100% when this number is below 20%. For example:
- 0% coverage progress = 0% rewards
- Between 0-20% coverage progress = between 0-100% rewards
- >=20% coverage progress = 100% rewards
- Activity is a weekly measure of the total amount of surface coverage submitted in a region. To maintain 100% Activity in a region, contributors would need to submit at least 75% as many total km every week as the estimated total road surface in the region. Rewards scale between 0% and 100% when Activity is below 75%.
- Resilience is a measure of how well a region’s activity is distributed. Resilient regions are not overly reliant on any individual contributor and, as such, resilience should provide a measure of confidence to map data consumers the observed Coverage and Activity trends will continue. For a region to maintain 100% Resilience, no contributor can be responsible for more than one-fifth (20%) of total km submitted over the prior 28 days. Rewards scale between 0% and 100% when this number is above 20%.
Region Progress, the final number used to calculate a region’s contributions to Global Map Progress and the size of the region’s rewards pool, is a weighted average of these three factors.
- Coverage: 60% weight
- Activity: 30% weight
- Resilience 10% weight
As an example, if a region had Coverage of 70%, Activity of 80% and Resilience of 50%, its Region Progress score would be (0.70 * 0.6) + (0.80 * 0.3) + (0.5 * 0.1) = 0.71 or 71%.
Map Progress Unit (“MPU”)
Section titled “Map Progress Unit (“MPU”)”Map progress can be measured with Map Progress Units (or “MPUs”) at a regional (RMPU) or global (GMPU) level.
For any given reward period, a region produces between 0 and 1 MPUs based on its coverage, activity, and resilience (see above: Regional Map Progress). The MPU calculation cannot result in a number less than 0 or greater than 1.
The GMPU is equal to the weighted average of the RMPUs for a given period. The GMPU is then used to calculate the amount of HONEY minted for contributors in that period.
Visit this Colab notebook to view the math behind MPU minting:
https://colab.research.google.com/drive/17e3oxLDinWzAfDVqjTV4SMeHzrF_rVJv
Example Global MPU Calculation
Section titled “Example Global MPU Calculation”For simplicity, let’s assume the world only contains three regions. We calculate GMPU by summing the product of each region’s weighting and regional progress.
- Region 1: Weighted at 60%, RMPU of 0.25
- Region 2: Weighted at 30%, RMPU of 0.16
- Region 3: Weighted at 10%, RMPU of 0.82
GMPU = (0.60 * 0.25) + (0.30 * 0.16) + (0.10 * 0.82) = 0.28
520 Total Global MPUs
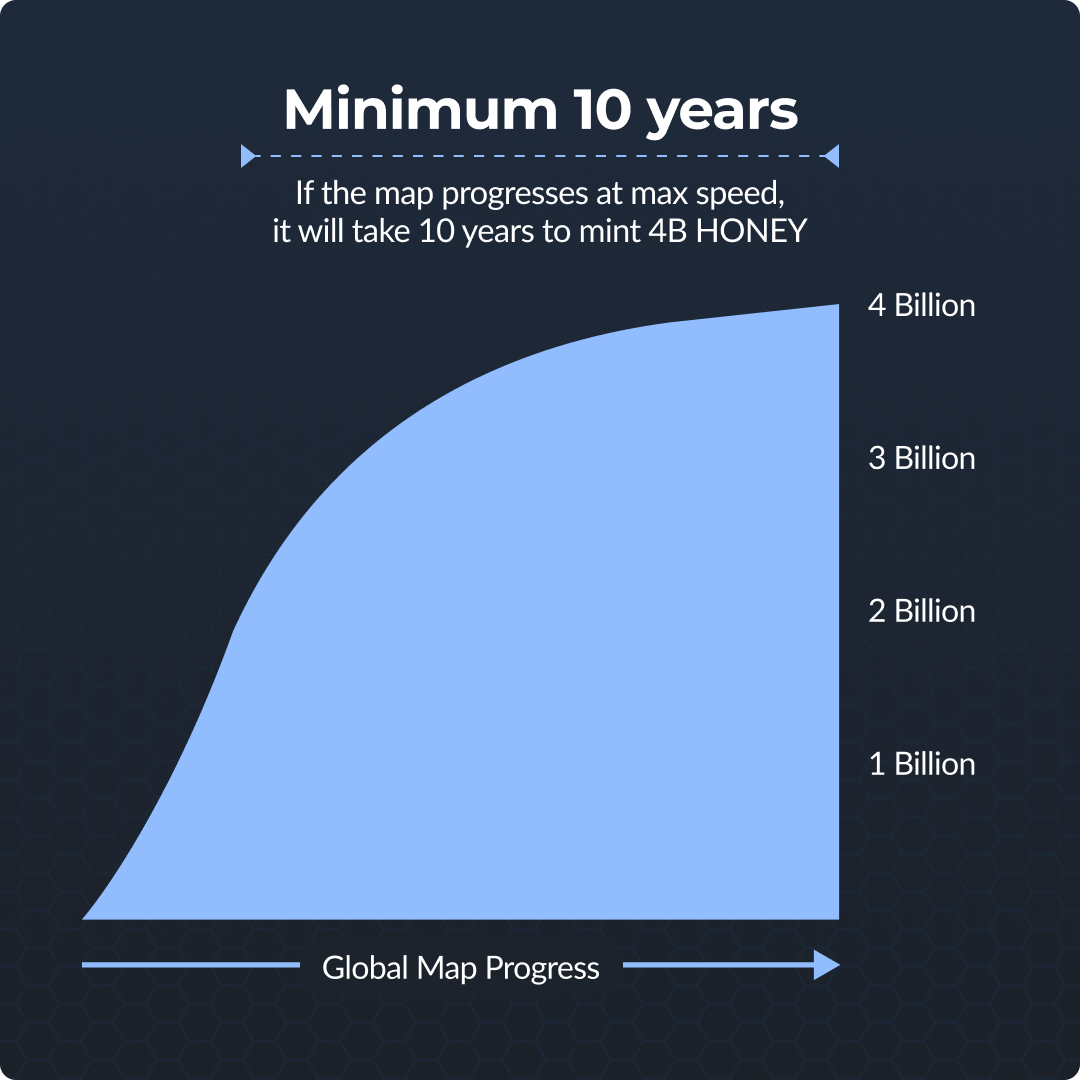
Section titled “520 Total Global MPUs”In order to create and sustain a robust network over time, the Hivemapper Network established a total number of Global MPUs that must be reached in order to mint the full amount (4 billion) of HONEY allocated to contributors.
HONEY will be minted as progress is made towards 520 GMPUs. Since no more than 1 MPU can be earned in a given weekly reward period, the minimum amount of time it will take to mint the full 4 billion tokens is 520 weeks or 10 years (= 520 total MPU / 1.00 MPU per week).
To further illustrate, let’s take the GMPU of 0.28 from the above example and assume it remains constant over time. It would take ~1,857 weeks, or ~36 years, to mint the full amount of HONEY (= 520 total MPU / 0.28 MPU per week).
While both of these example scenarios are very unlikely, it’s difficult to predict how fast actual Global Map Progress will be made. The GMPU calculation will continually approach 1 as every region of the Hivemapper becomes more covered, active, and resilient.
HONEY Minting and Distribution
Section titled “HONEY Minting and Distribution”The amount of HONEY minted in a given week will be relative to the current period’s GMPU calculation and the total amount of GMPUs calculated in prior periods. Generally, earlier progress is rewarded with more HONEY than later progress.
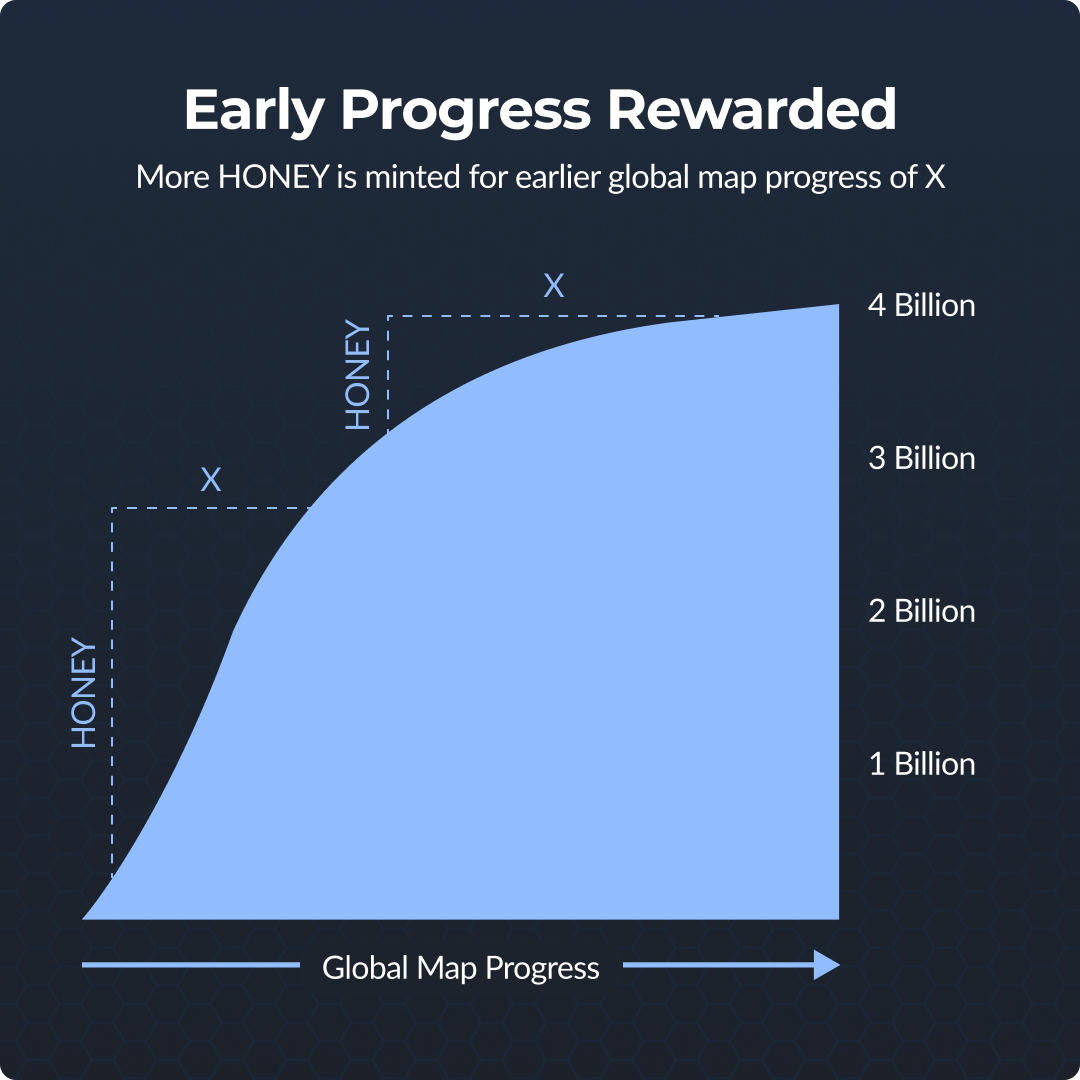
More HONEY is minted for earlier global map progress of X.
While GMPUs determine when the 4 billion HONEY designated for contributors will be minted, they do not limit or factor in HONEY earned by contributors through Map Consumption Rewards, or from special Hivemapper Foundation rewards such as bounties and airdrops.
HONEY Earned by Region
Section titled “HONEY Earned by Region”Once the total HONEY rewards have been calculated on a global level for a given period, the HONEY trickles down to each region’s reward pool proportional to its regional weighting. This methodology does not apply to Map Consumption Rewards, which are given directly to the contributors who helped supply the specific data consumed.
Example Regional HONEY Calculation
Section titled “Example Regional HONEY Calculation”Let’s assume the network has the same three regions from our prior example, the GMPU is 0.28, and 1,000,000 HONEY is minted for the current reward period.
- Region 1: Weighted at 60%, RMPU of 0.25
- (0.60 * 0.25) / GMPU of 0.280 * 1,000,000 = 536k HONEY
- Region 2: Weighted at 30%, RMPU = 0.16
- (0.30 * 0.16) / GMPU of 0.280 * 1,000,000 = 171k HONEY
- Region 3: Weighted at 10%, RMPU = 0.82
- (0.10 * 0.82) / Global MPU of 0.280 * 1,000,000 = 293k HONEY
HONEY Earned by Contributor
Section titled “HONEY Earned by Contributor”The regional HONEY reward pool is split amongst the network members who made contributions to the region during the given rewards period. An individual’s exact earnings depends on the relative amount of contributions they made to the region during the period and other individual reward factors.